One of the more reliable indicators of which NHL team is likely to get the next power play has little to do with score or style of play. Instead, it’s been shown repeatedly (Ex 1, Ex 2) that referees call a substantially higher number of make-up penalties than would otherwise be expected in order to maintain an overall even number of violations on each team. Call it a biased impartiality – in order to appear impartial by game’s end, ref’s let previous decisions drive future ones.
A common line of reasoning behind call reversals is that referees would prefer to $not$ be part of the final narrative as to why a particular team won or lost. If each team has a relatively similar number of power plays, media and fans clamoring that one team was favored would have less support. Turns out, however, that by evening up penalty calls, hockey ref’s are impacting the same game narratives that they are trying to avoid being a part of. In this post, I’ll both confirm the existance of make-up calls and extend a similar analysis to look at the impact of make-up calls on game outcomes.
The make-up call
Claiming that a call in any sport is due to anything besides an unbiased referee assessment is a non-trivial task. Fortunately, hockey boasts several settings that make looking for make-up calls somewhat feasible. Game’s are often tied, and looking at penalties in tied-game states can avoid results being impacted by changes in style of play due to the score. Moreover, with an average of about eight minors a game – most of them judgement calls – there’s a large enough sample size within each game on which to evaluate ref choices.
Here’s an initial chart comparing the penalty differential between each team at the end of the first period (y-axis, where positive means more penalties) to penalty differential over the remainder of the game (shown in the darkness and color of the grid).1 The x-axis corresponds to the home team’s estimated pre-game win probability, calculated using odds implied by betting markets (you can get that data here). Accounting for relative team talent is potentially important, as its a variable that’s quite possibly linked to penalty calls and team aggressiveness. Only games that were tied at the end of the first period are included in this chart – the data goes from the 05-06 to 15-16 regular seasons.
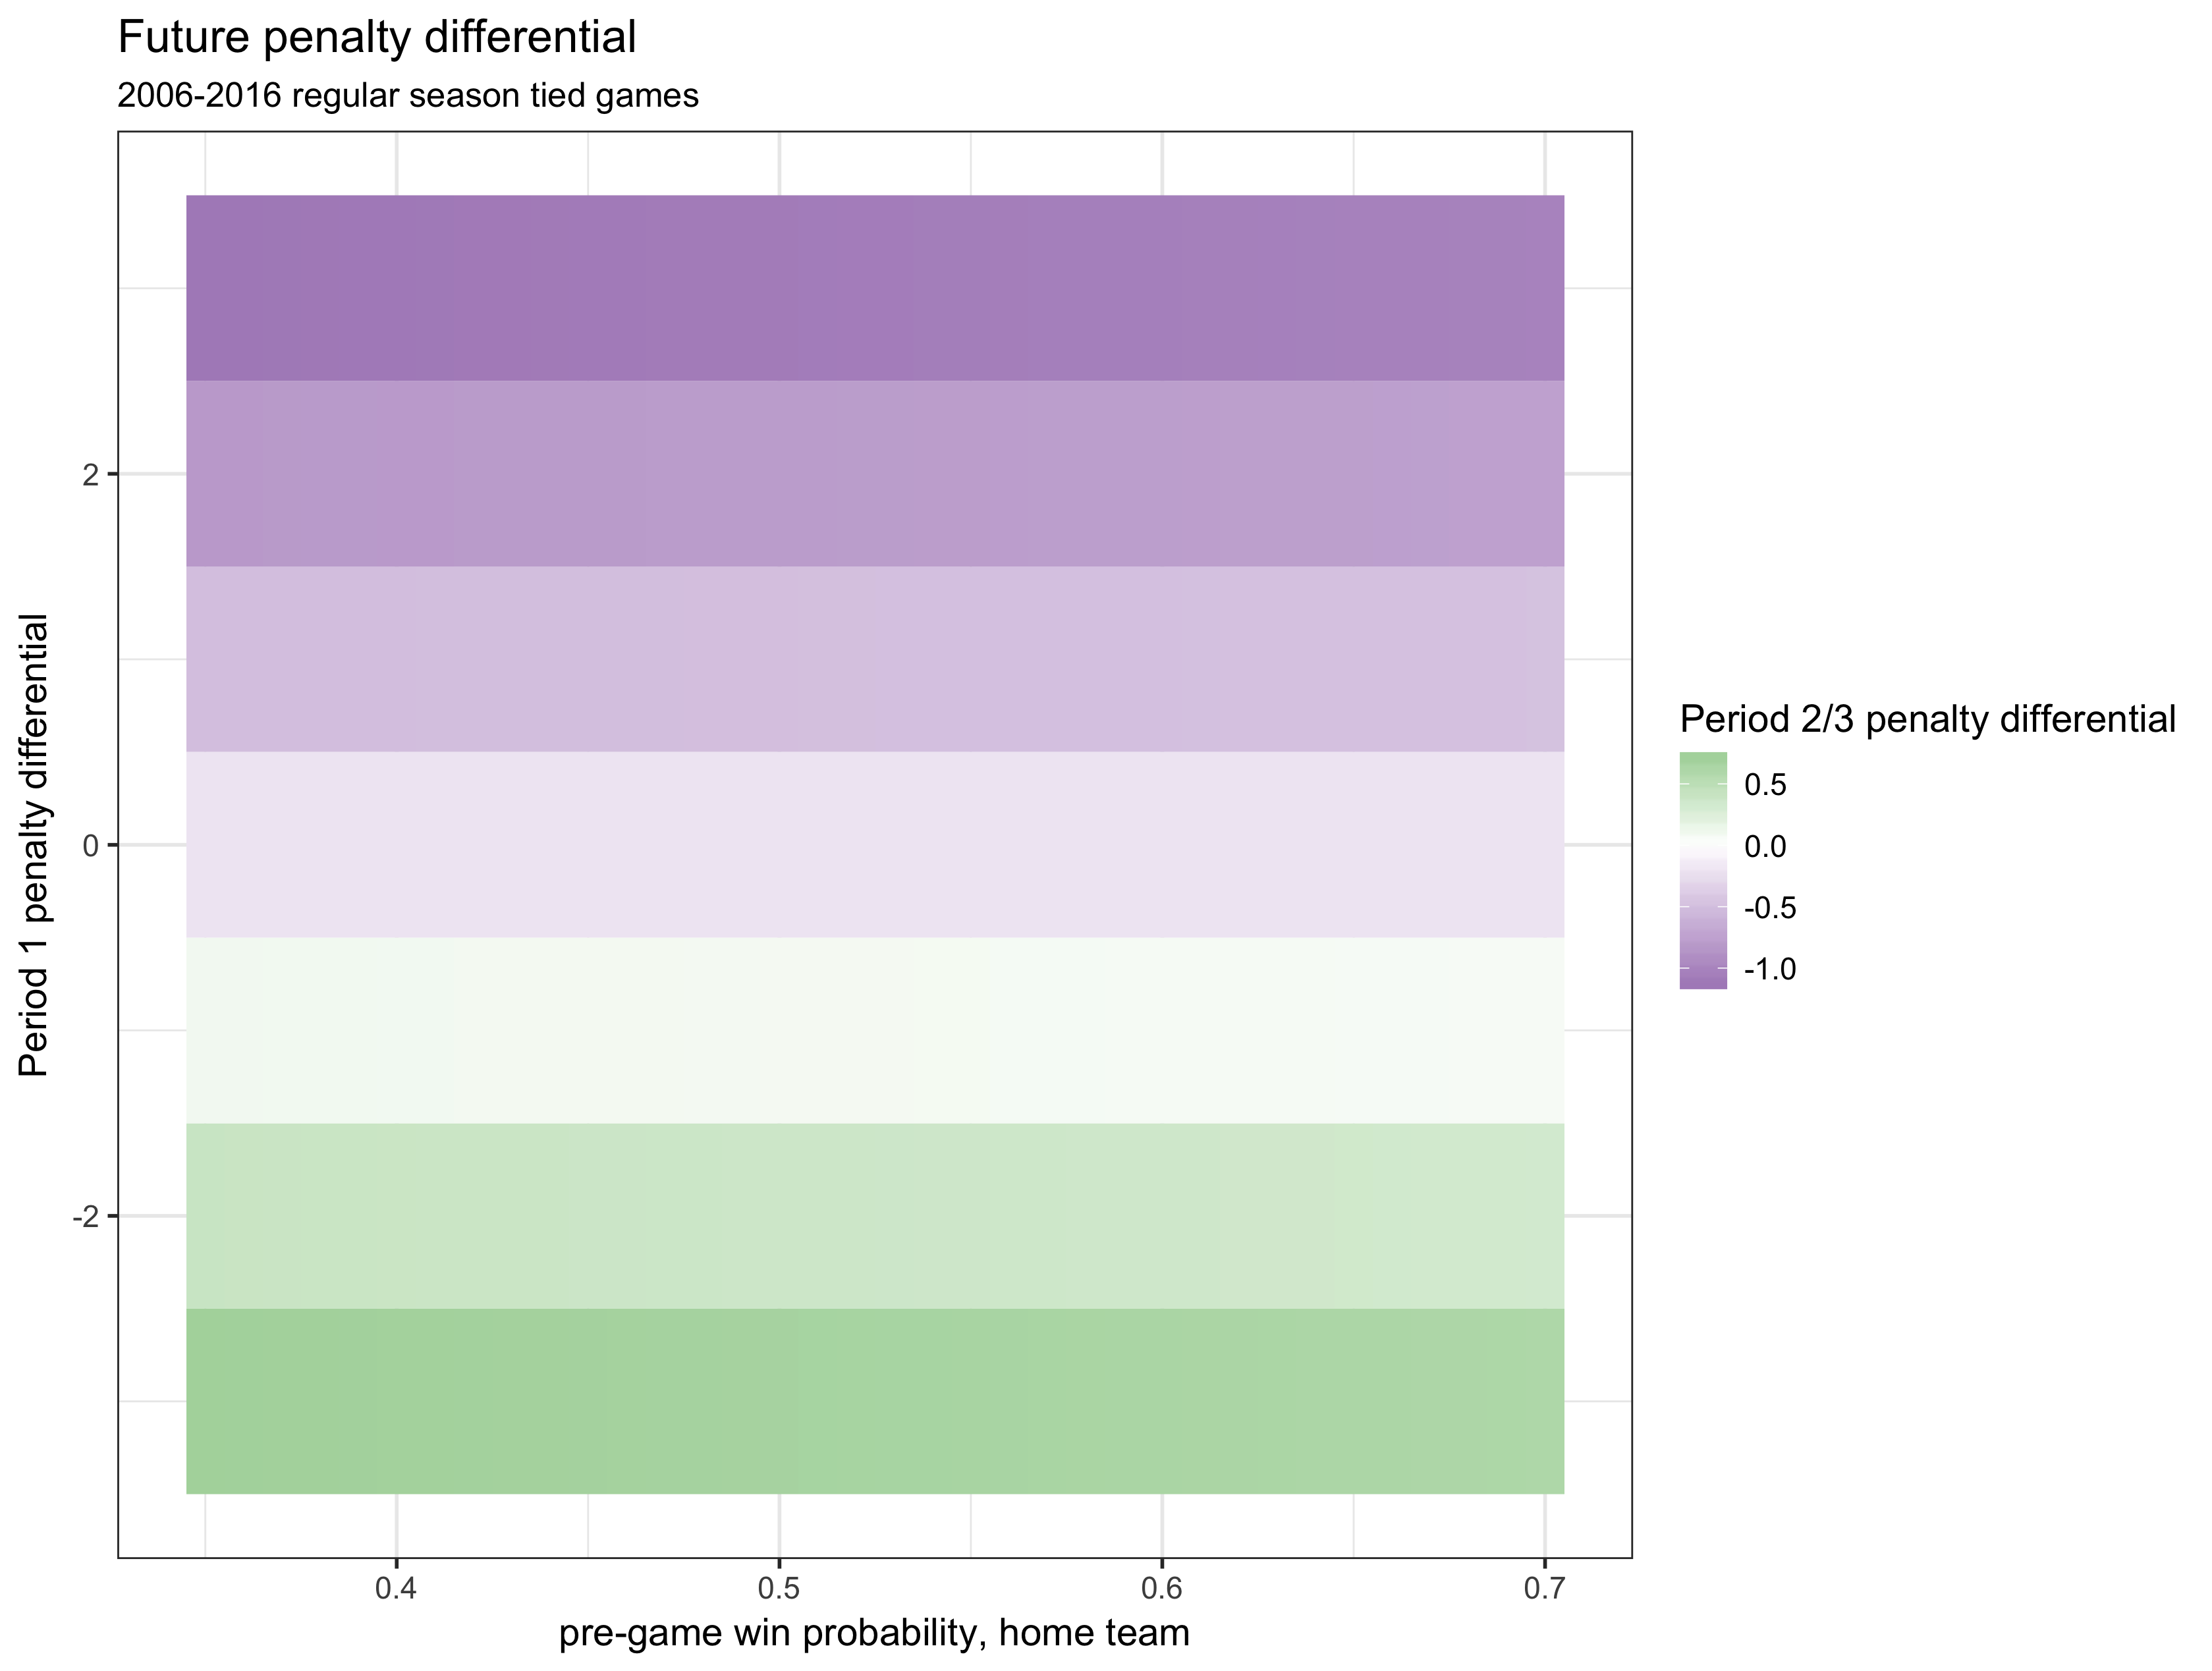
When home teams have two more infractions than their opponent at the end of the first period, they average roughly 0.8 fewer infractions the rest of the game. Alternatively, when home teams have two fewer penalties at the end of the first, they average about 0.5 more violations in periods 2 and 3. The difference between having more and fewer penalties in tied games is quite significant from a statistical perspective. Of course, if you had read a few of the links above, you probably would have guessed that there would be this type of impact. But the effect size (an extra 1.3 power plays in 2 periods), as well as the shading consistency of the chart above, seemed noteworthy.
The impact of the make-up call
A make-up calls is all well and good until one team loses a game because of it.
To check how future games are impacted by make-up calls, I used a chart similar to the one shown above. In this one, however, shading reflects the percent of games eventually won by the home team.2
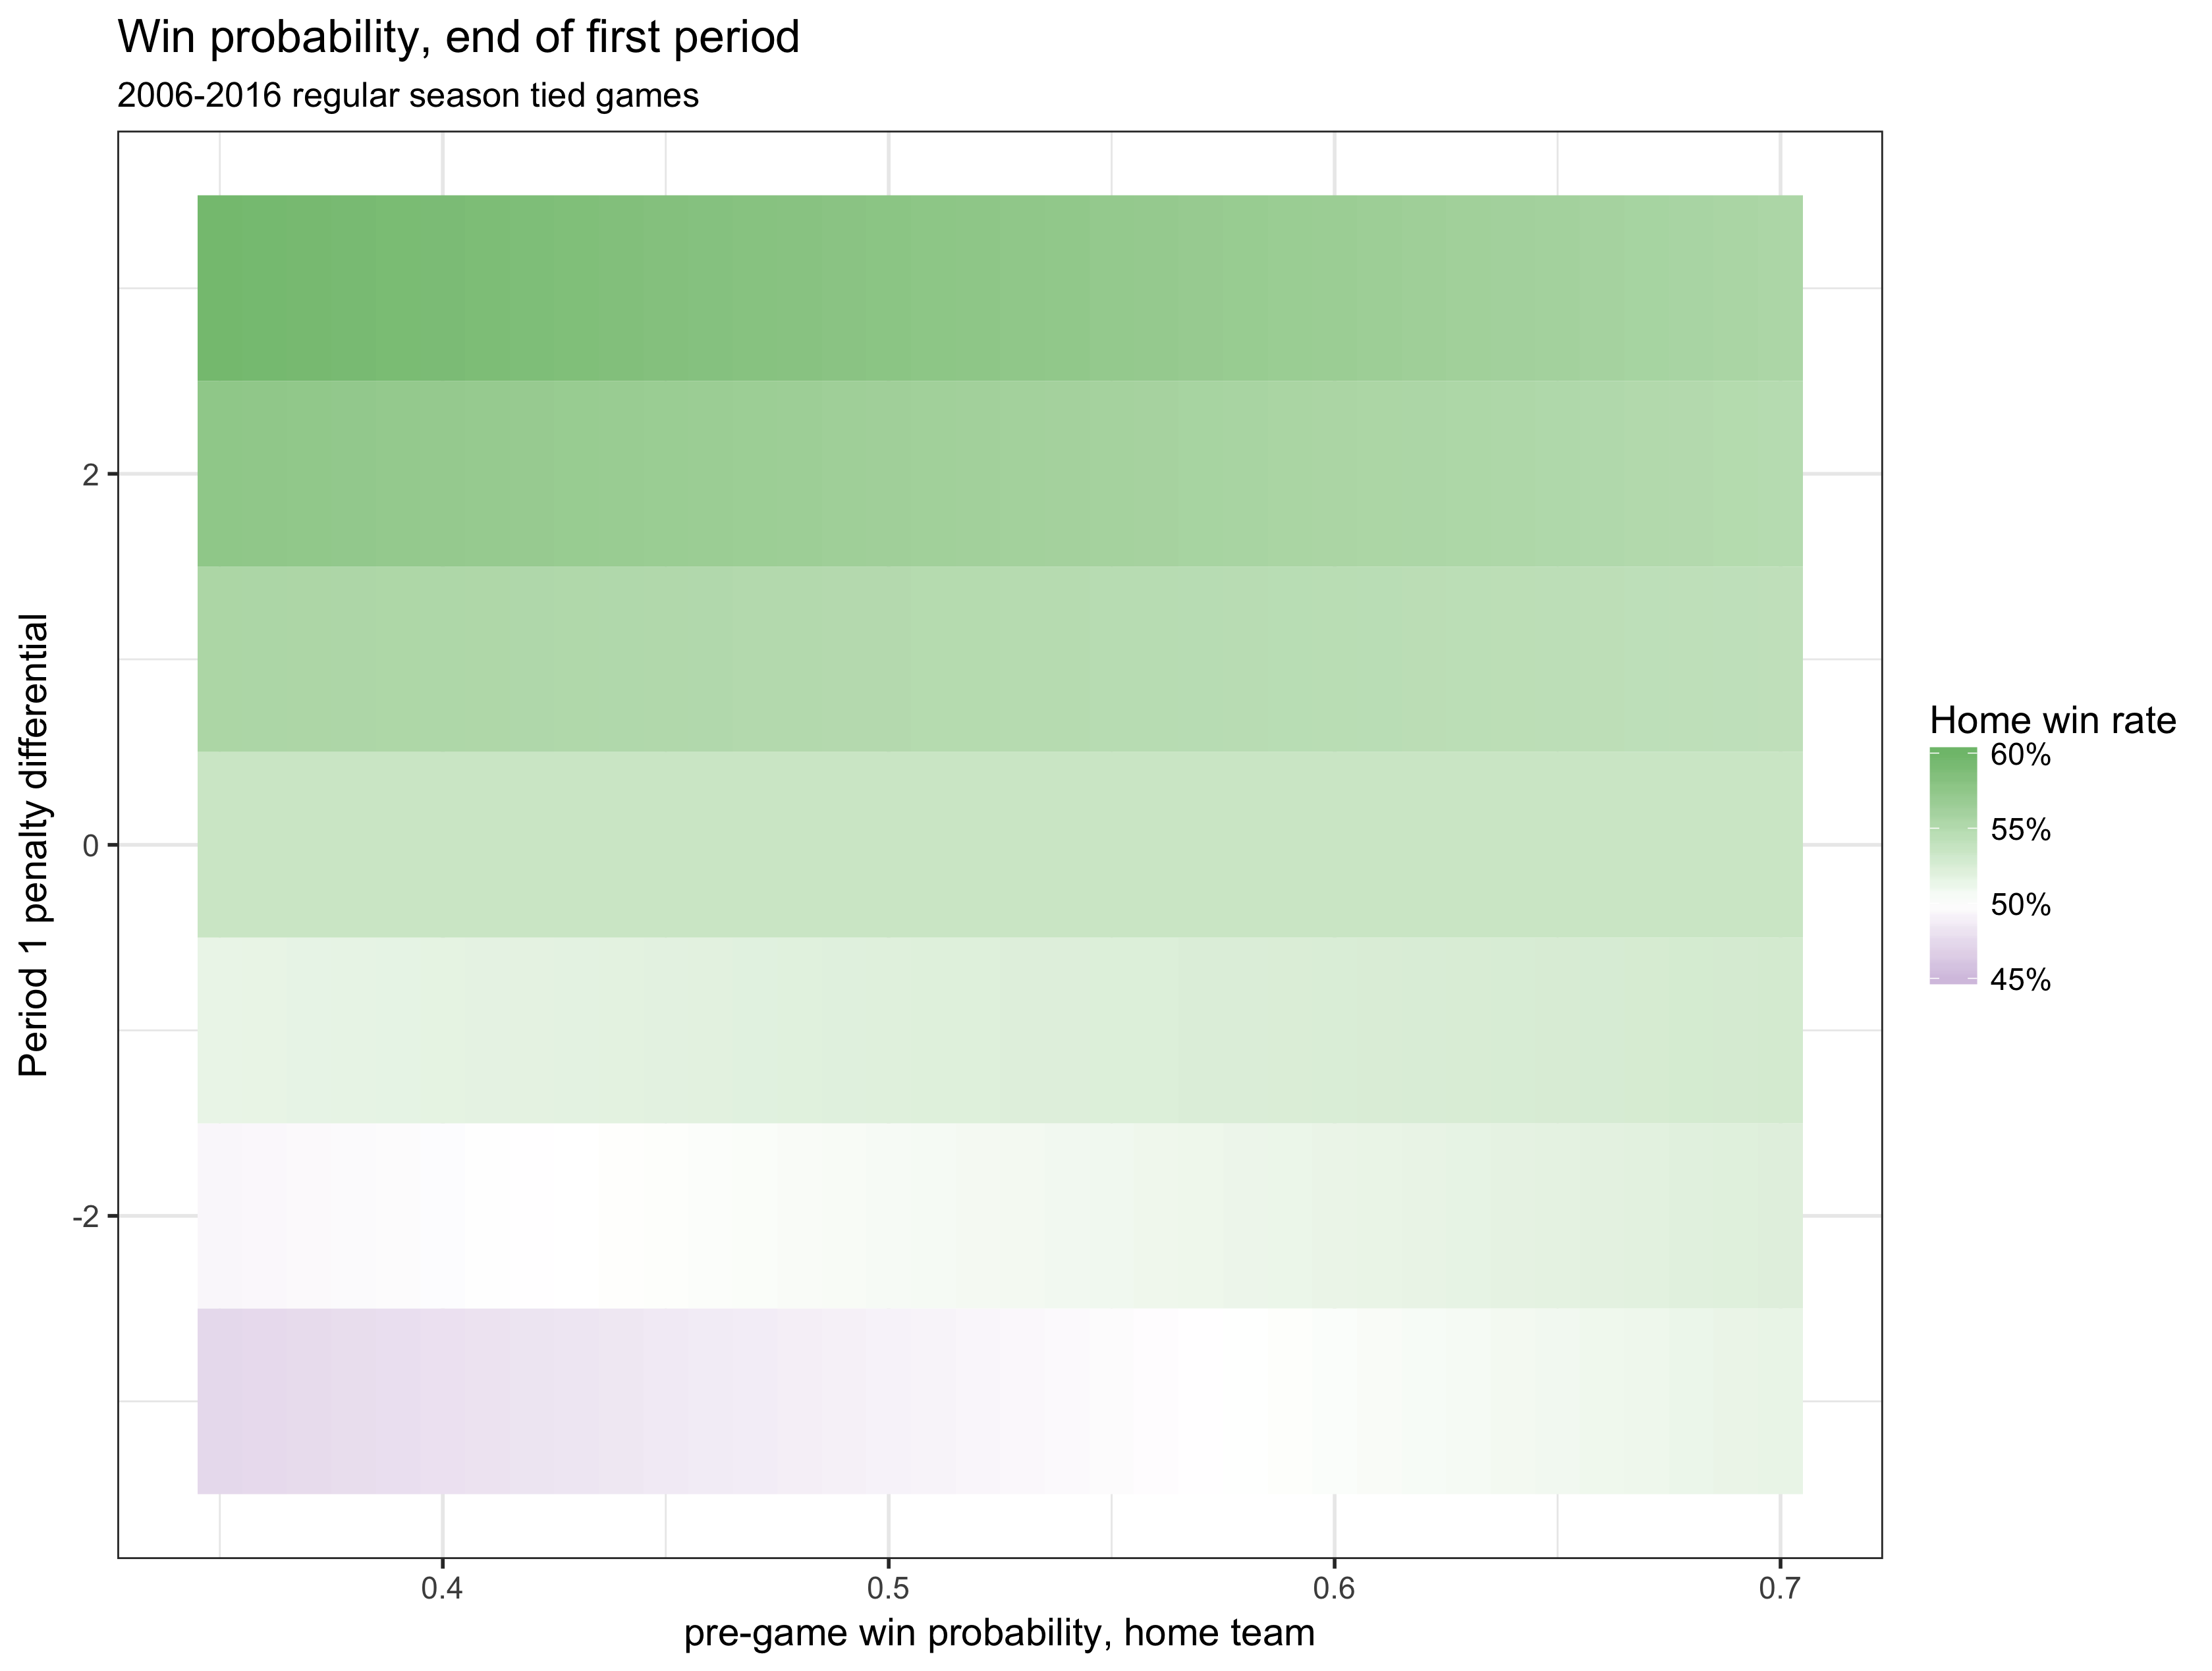
In this version, the shading is reversed – more first period penalties are linked to an increased win rate, just as fewer penalties are linked to a decreased win rate. Again, remember that we’re only looking at tied games, and we’re accounting for how good each team is!
Altogether, when the game is expected to be a relative toss-up, the difference between having two more first period penalties and two fewer first period penalties is about 7 or 8 percentage points in terms of the home team’s chances. The effect is a bit larger when the home team is not expected to win, with differences between fewer and more first period worth an estimated 10 percentage points.
While this may seem like a relatively minor change, the fact that there’s $any$ change in win rate based on prior penalties is curious given that we’re only looking at tied games. Additionally, we may be underestimating the impact of make-up calls – if a team had more first period penalties, it would have likewise been more likely to start the second period on a penalty kill, a quirk that I did not account for above. Further, this isn’t a peculiar set of games – about a third of NHL games end the first period tied. Finally, although it’d require further assumptions with respect to playing style, it’s also likely that make-up calls have an impact on games that aren’t tied.
One limitation of this post is that, in using observational data, it is feasible that there’s something else responsible for the link between first period penalty differential and game outcomes. One possible alternative is that teams that have taken penalties suddenly feel the need to be more aggressive, which then leads to more natural reversals masquerading as make-up calls. However, for tied games, I can’t imagine that the revenge factor looms too large. Further, in previous work, I found that penalty reversals were, if anything, higher in the postseason, where there is almost no desire for revenge (at least via penalties).
If you are curious about the coding for the project, I used play-by-play data via the now archived nhlscrapr package in R. Matching minors, as well as all major penalties, were dropped. The code for all figures, models, and numbers is here.
- I used a generalized additive model (GAM) of penalty differential as a factor of both home team win probability and first period penalty differential. In this and the example below, first period penalty differential was a significant predictor. GAMs make sense in this and other examples, as the true model fit with penalty outcomes is unknown. ^
- Same model as above, now with a binary outcome. ^