In yesterday’s post, I walked through the use of a state-space model to evaluate NHL team strength over the course of an NHL season.
But analyzing team strength is just the start of how we can use this type of framework to analyze betting market data in sports. In today’s post, I’ll ask a different question – What team had the best home advantage? And did perceptions of any teams (cough cough, Vegas) change over the course of the season?
The Vegas Flu
Around mid-December – according to a Google search, December 20th – the public became aware of the Golden Knights’ incredible start at home. Vegas started the season 14-2-1 at T-Mobile Arena, shocking pre-season predictions that had the Golden Knights as one of the worst teams in hockey.
Yesterday’s post used a time-varying model of team strength that, while able to pick up on changes in team strength with Vegas, also assumed that (i) each NHL team had the same home advantage and (ii) there was no impact of team rest on market numbers. However, both of these assumptions are testable with by adding a few more variables to our model.
Here was our initial model: \[ \text{E}[\text{logit}(p_{i,j,w})] = \theta_{i,w} - \theta_{j,w} + \alpha, \] We expand that model to \[ \text{E}[\text{logit}(p_{i,j,w})] = \theta_{i,w} - \theta_{j,w} + \alpha_i, \]
which allows for each team \(i\) to have its own intercept. But we’re not done yet. The final model,
\[ \text{E}[\text{logit}(p_{i,j,w})] = \theta_{i,w} - \theta_{j,w} + \alpha_i + \beta_1*Rest_i + \beta_2*Rest_j, \] includes binary indicators \(Rest_i\) and \(Rest_j\) which indicate whether or not the home (\(i\)) or away (\(j\)) team was better rested prior to the game. Note that for rest variables, if both teams had the same rest, or both teams had at least one day of rest, these indicators were set to 0. Rest variables are important, as we hope to be able to tease out the benefit of playing at home from the benefit of playing a non-rested opponent at home.
Are home advantages different?
Yes, it appears they are.
Here’s a plot of the posterior distribution of \(\alpha_i\) for each team \(i\).
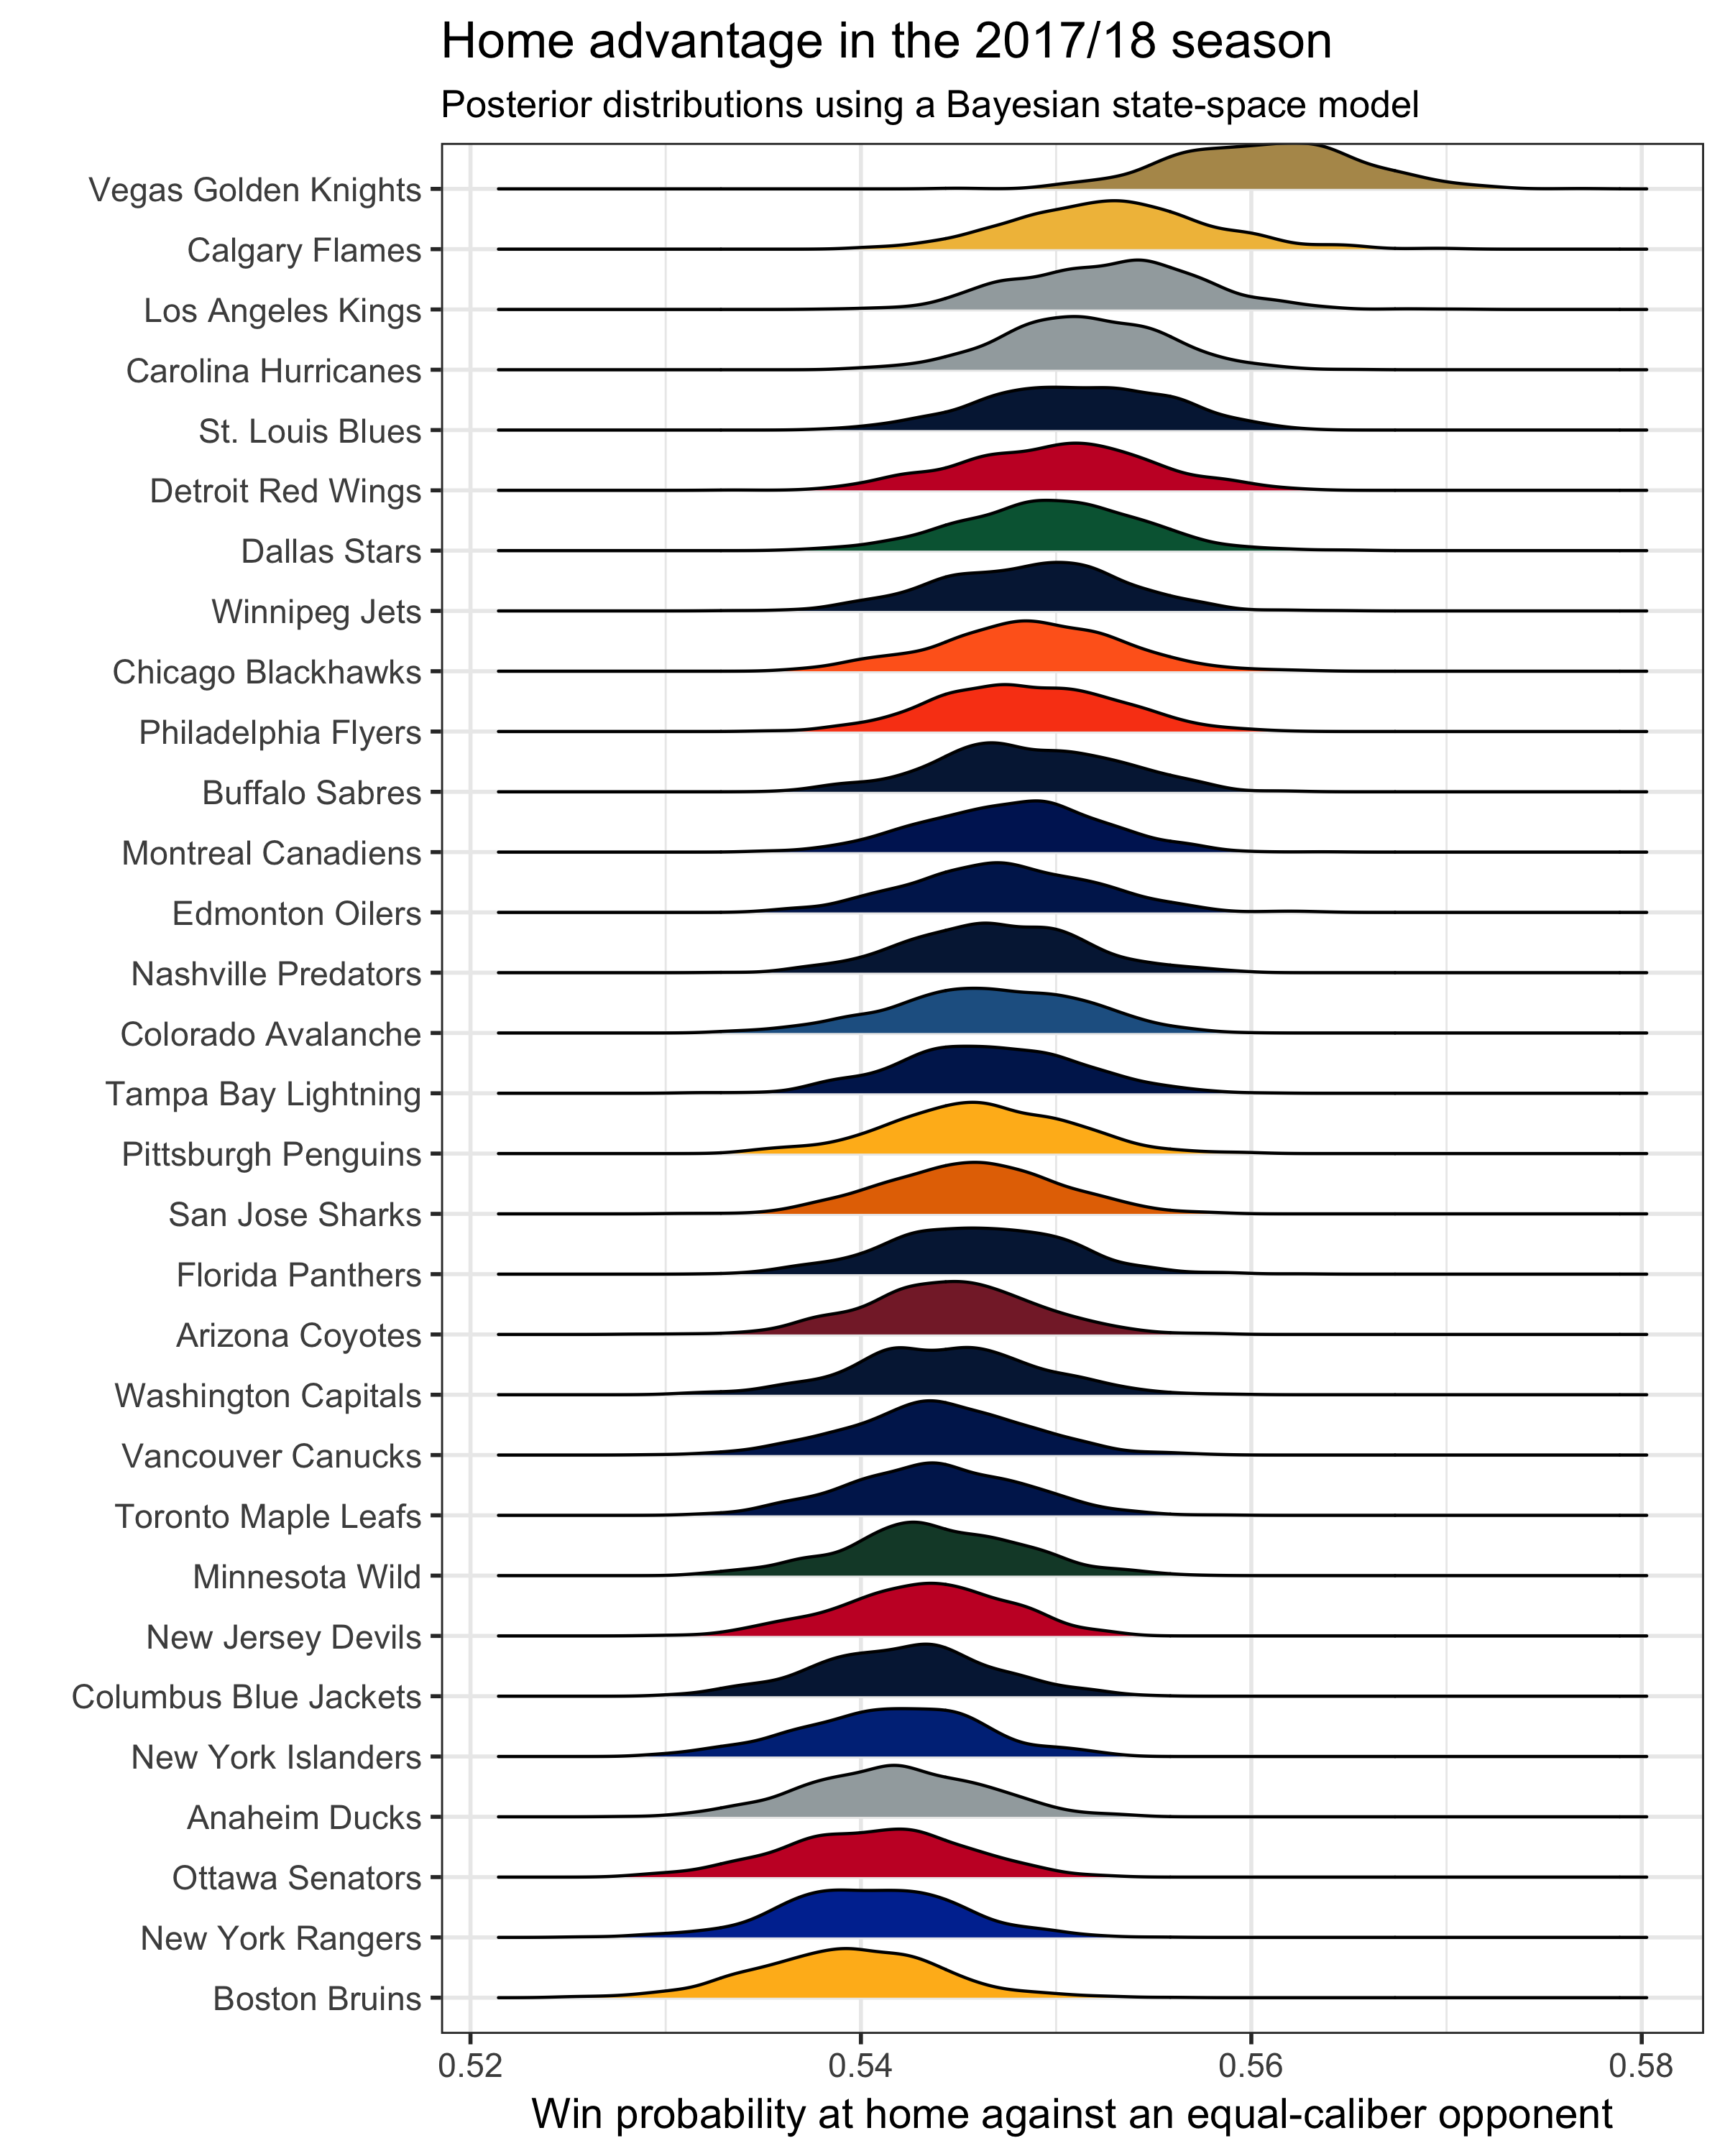
Each teams’ curve corresponds to their estimated prediction of beating an equal-caliber opponent at home. League-wide, the average is about 55%, but some teams lie above and below that average.
Overall, betting markets linked Vegas with the best home advantage during the 2017/18 season, as judged by the posterior distribution of the Golden Knights’ \(\alpha\). However, we can be more precise: there’s about a 90% chance (using the overlap in the density curves) that Vegas was given a better home adjustment than the second best team (LA Kings). Altogether, the gaps between teams with the best and worst home advantages appear unlikely to be due to chance, which matches our findings in our original paper (link).
Did home advantages change?
I replicated the same model fit above using both games before and after December 20th. Why that date? First, it’s the date of the ESPN article that publicized the idea of the Vegas Flu. Second, it’s close enough to the halfway mark of the season that it’s likely we have enough home games to judge each team with.
Here’s the Golden Knights’ home advantage, both before (dark curve) and after (light curve) December 20th.
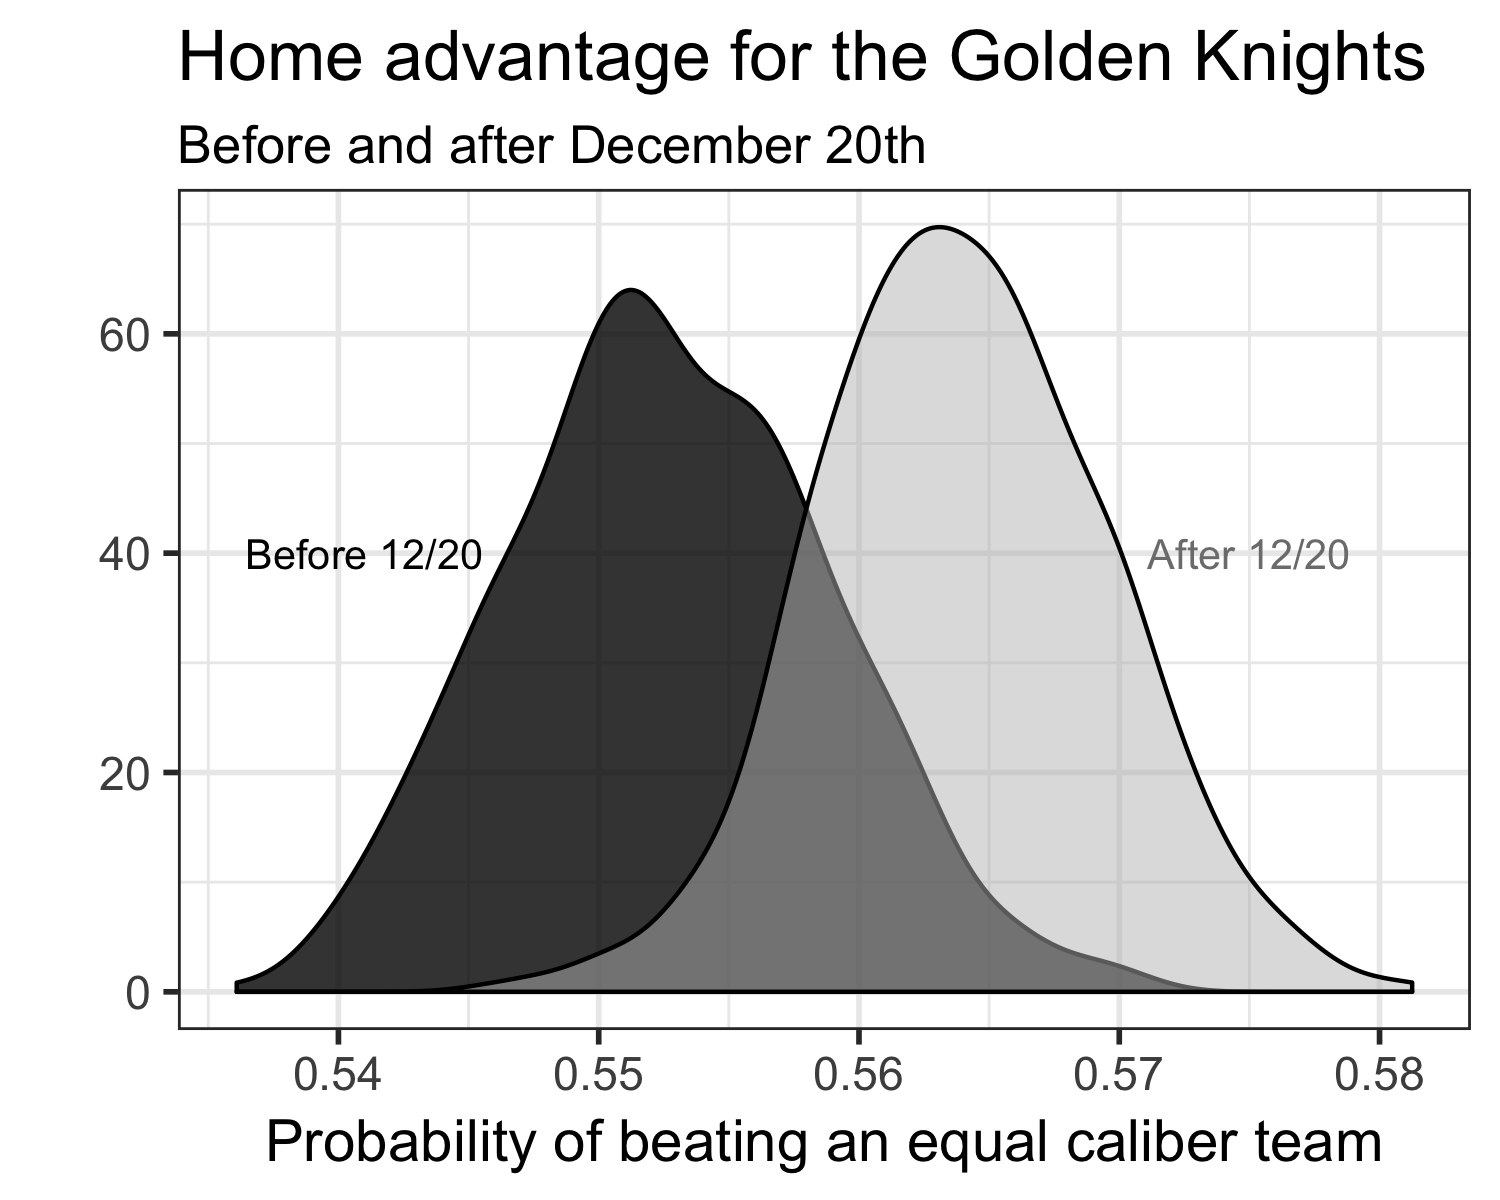
Altogether, it looked like the Knights’ expected win percentage at home was given about a 1.75 percentage point bump after December 20th. This appears significant – but there’s also enough overlap in the two density curves that the increase could be due to chance. From a practical standpoint, this increase would plausibly effect the outcome of no more a game or two – but from a betting market standpoint, an increase of 1.75 percentage points is notable.
Of course, it’d be more precise to consider the Golden Knights’ increase in light of changes to the home advantage intercepts among other teams.
Here’s a plot with every teams’ density curves, showing the home advantage both before (in dark) and after (in color) December 20th. Curves shaded in red reflect teams where the home advantage decreased – teams in blue correspond with an increase. I also organized teams in a weird order – from those with the biggest drop (Chicago) to the biggest increase (Vegas).
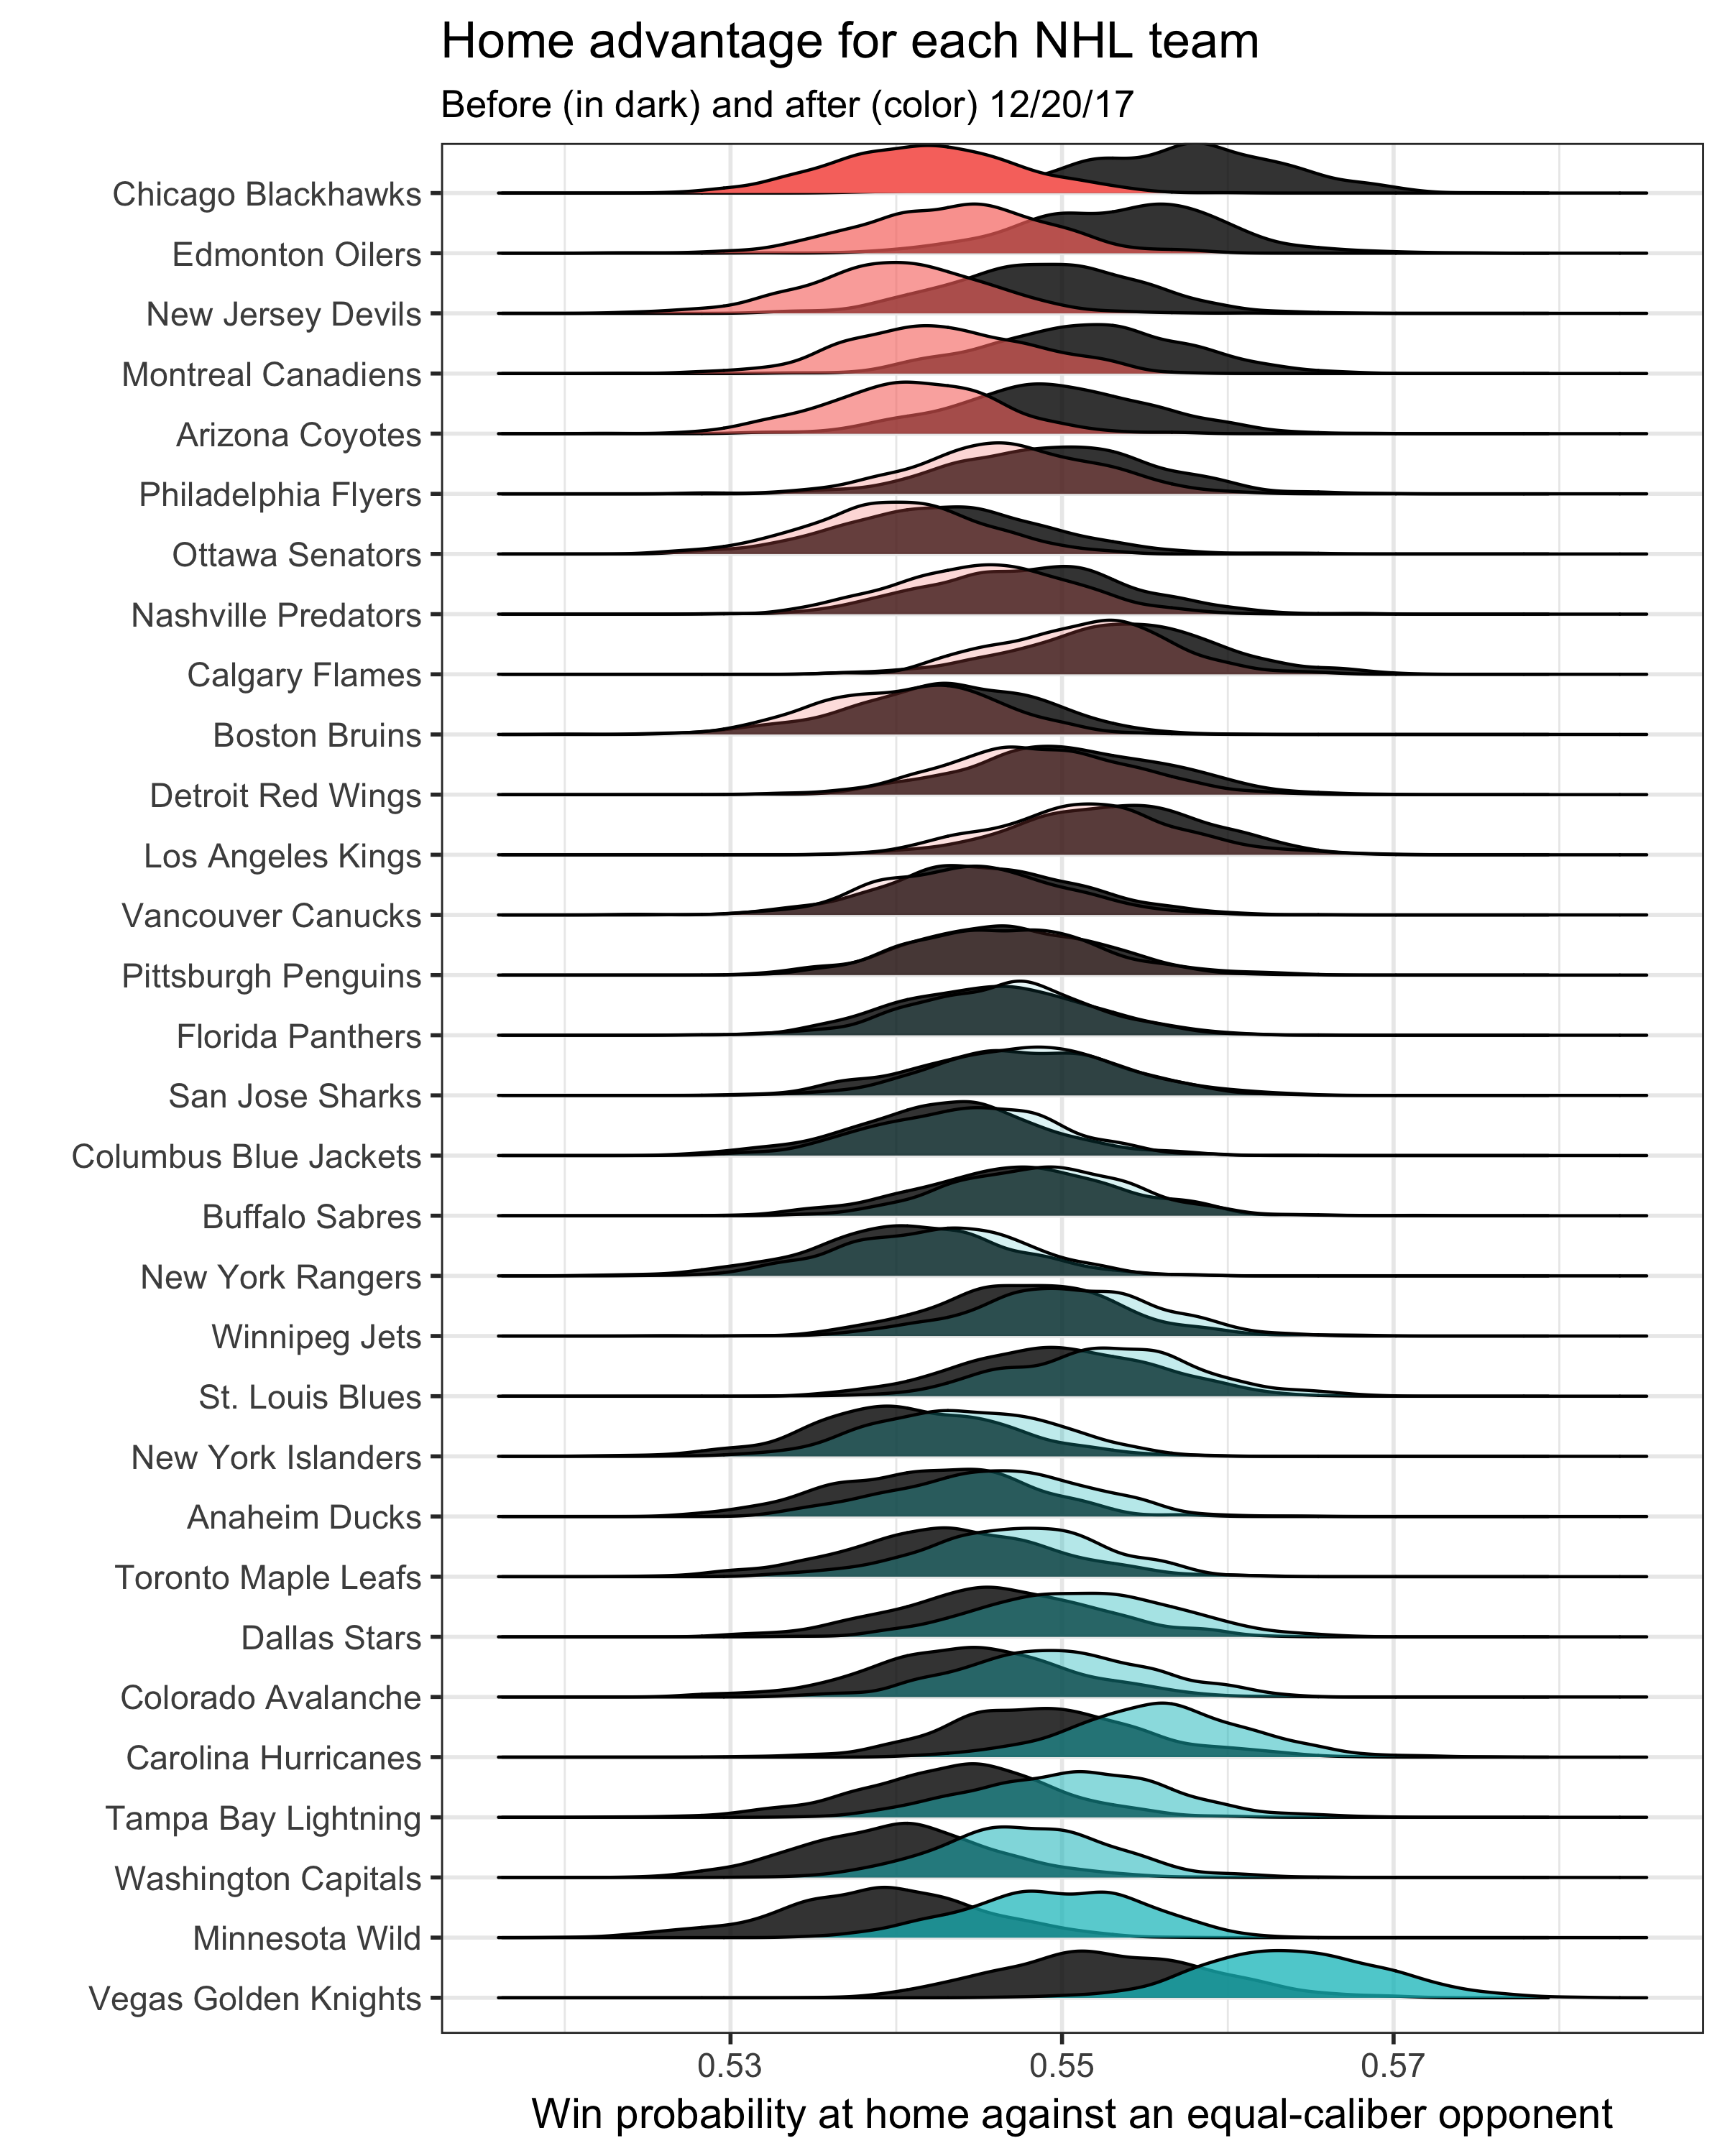
I feel a bit like Jack Buck here: I can’t believe what I just saw.
The team with the biggest change in home advantage is not Vegas but Chicago, which observes an estimated win percentage drop by nearly 2 percentage points. Edmonton and Montreal, the two franchises that, combined with the Blackhawks, had the three most disappointmenting seasons in the NHL, also observe drops in perceived home advantage.
What does this suggest?
There are likely two possibilities.
First, market-perceived home advantage correlates to team strength. If the Blackhawks or Oilers stink, it is reasonable to think that playing in Chicago or Edmonton is less of worry for opponents. Fewer fans are showing up, referees are less likely to give the home team a call, and the home team is, even after accounting for team strength, a hair less likely to win.
Second, which is an important caveat, our model can’t pick up when teams play different players (e.g. backup goalies). In other words, if opponents started the year playing their backups in Chicago, but ended the year playing their starters at Chicago, we’d likely be calling what was really a change in opponent behavior a change in home advantage. Alternatively, if the Blackhawks started the year playing Corey Crawford in net for all of their home games but ended the year playing, for sake of argument, a beer-league goalie off of the street, our model would not pick up on that.
Either way, hopefully this post highlights some of the potential that can be found when analyzing market numbers. We can be sure that the market values each teams’ home advantage different, and that by years’ end, Vegas was given the biggest adjustment when playing at home. It’s also possible that how the market views each teams home advantage is tied to how good that team is at a particular time point.