The best team in baseball during the 2013 season was the Detroit Tigers.
Detroit’s rotation featured the eventual Cy Young award winner (Max Scherzer), alongside both the 2011 and 2016 Cy winners (Justin Verlander and Rick Porcello, respectively). The Tigers line-up was spearheaded by Prince Fielder and Miguel Cabrera, the latter of whom would win his second consecutive MVP. Indeed, betting market rankings had the Tigers atop the sport for basically the entire season.
But on October 19th of that year, the best team in baseball was fighting to save its season. The Tigers trailed the Boston Red Sox three games to two in Game 6 the American League Championship series, with each of Detroit’s three losses coming by exactly one run. Needing a win to force a game 7, Scherzer gave the Tigers a bit of hope, in the form of a 2-1 lead as the teams went to the bottom of the 7th inning.
It’s at that point in the game that the best team in baseball was also its unluckiest.
It started with a runner on second, one out, and Xander Bogaerts at the plate. With a full count, Scherzer threw a pitch that umpires almost always call a strike 3.
But instead of strike 3, home plate umpire Dan Iassogna called the pitch ball 4. And so instead of a runner on 2nd and two outs, the Red Sox now had two runners on and out out. Iassogna’s decision – one umpires only call a ball about 1 in 7 times – dropped the Tigers’ win expectency by about 12 percentage points.
Next, Detroit reliever Drew Smily induced a chopper up the middle off the bat of Jacoby Ellsbury, hit in the direction of shortstop Jose Iglesias. It’s the type of play Iglesias often starts a double play on. Worst case for the Tigers, one would think, he’d record only one out.
But Iglesias bumbled the ball, recording no outs and leaving the bases loaded. Allowing for one out on the play, the error was worth about a 20 perentage point drop in win expectency for Detroit.
Scherzer and the Tigers should’ve been out of the inning but for a few bad breaks. But they weren’t, which allowed Shane Victorino to step to the plate with the bases loaded. Victorino’s at-bat involved a little less luck; he hit a grand slam, and the Tigers season was effectively over.
The Tigers’ final game was heartbreaking, and indicative of one of the most humbling aspects of being a sports fan: the better team doesn’t always win, even when it may deserve to. It happened for the Tigers in 2013, but it happens for all teams in all seasons and in almost all sports. Sometimes it’s factors that are completely outside of a the better teams control – a referee call, a bad bounce, poor conditions, or, like the Tigers, a missed strike three. Or sometimes the better team just plays poorly – missing open three-pointers, field goals, saves, or, like the Tigers, easy ground balls up the middle. Or sometimes the “better” team might simply be so close in terms of talent to the “worse” team, that any number of plays, shots, or referee decisions could play into the game’s outcome, actions that, by and large, are noise and not indicative of any particular skill or talent. However it happens, being the better team doesn’t exactly equate to always being the team with more runs, goals, or points.
When Greg, Ben and I set out to compare North American sports, our principal goal was to consider how often, in each sport, the better team ended up winning. Here’s our main take-home, which summarizes the game-level randomness of each league.
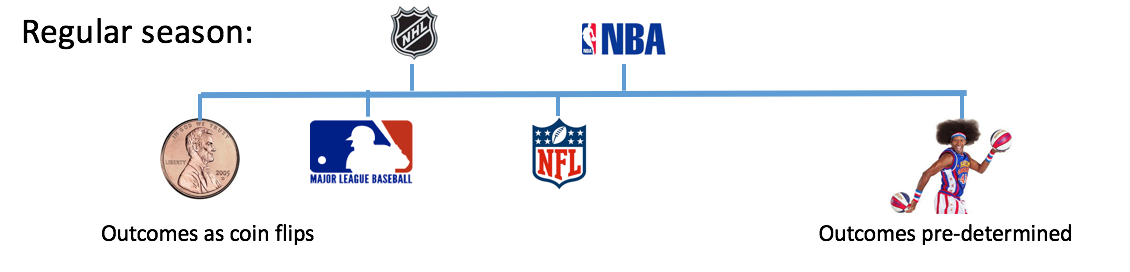
On the far left, the NHL and MLB games cluster closer to coin flips; that is, if we were to randomly take a game between two randomly drawn teams, it’s less likely that the best team will win. As referenced above, part of this is luck – one can surmise that given the low amounts of scoring involved in baseball and hockey, more breaks are needed to win – but a related part of it is also because the best teams in the MLB and in the NHL can still lose to the worse teams and fans wouldn’t be that surprised. The gaps in talent in those leagues are, at least relatively, not as wide.
Alternatively, the NFL and NBA roughly live in a world halfway between coin-flips and pre-determined outcomes.
Our findings are somewhat unique. There’s a whole literature on competitive balance that’s out there, with which we are only in partial agreement. For example, though tempting, answering a question like ours can’t be done using win percentages, because win percentages are effected by things like schedule strength and number of games.
But more importantly, our findings highlight the immense power of betting market data which, when combined with a statistical modeling framework that can account for changes to team strength, allows us to capture league-level and team-level traits that have, to-date, mostly been unknown.
Indeed, Scherzer’s bad break is but one anecdote behind several ways in which our work can inform decision makers and fans alike. Here’s a list of several take-homes that come with a better understanding of the randomness of sporting outcomes.
Luck (or just generally uncertainty) plays an enormous role in MLB and NHL outcomes. The worse team can beat the better team. Sometimes, shit just happens.
Looking at standings to determine how good each team is? Stop – you can do better. Our betting market metrics of how good each team is are better predictors of future won-loss percentage than current won-loss percentage is. In other words, if you look at the standings, and I look at betting market data, I’ll have more accurate predictions of how the rest of the season will shake out than you will (and I don’t even need to know win percentages to make that claim).
Afraid of our modeling? Use Mike Beuey’s ratings at Inpredictable. Bookmark his site. Market ratings like this are more on point than just about any public metric out there, and certainly better than standings or most power rankings. The data’s that good. If you want to know how good a team is, check to see when it’s a favorite or when it’s an underdog.
Here are a few specific ways that decision-makers could use betting market information.
Is your team going to make the playoffs? Start with betting market data, estimate probabilities for each game and each team, simulate the rest of the season, and find out.
Should you trade for a certain player? Here’s an easy, back-of-the-envelope way to estimate how valuable a player is: compare how betting odds stack up when this player is and isn’t in the lineup.
What are your chances of winning a title if you do make the playoffs? Simulate the postseason. Don’t be surprised if your team doesn’t win, even if it’s the best team (hint: I’ll do this in my next post)
Altogether, the traditional mechanism by which we evaluate teams — wins and losses - can belie characteristics that are vital to understanding team strength. Turns out, NHL and MLB outcomes are closer to 50-50 calls than those in the NFL and NBA, and the difference between those two pairs of leagues is fairly large. For fans, and perhaps Max Scherzer, hopefully this provides a modicum of comfort when your favorite team falls short.
Note: This is Part I in a set of posts of how betting markets can inform sports fans. To return to the series homepage, click here.